WSDL by JMeter
Steps to test a web service using JMeter are
a) Creating a test plan
Test plan created trough the GUI is saved in .jmx format. Although test plan can be edited by following the JMeter xml schema, modifying the test plan using GUI is much easier.
Right click on the Test plan and add a Thread Group element-SOAP/XML-RPC
b) Configuring the test plan
- Number of threads(users) : No. of concurrent users to be simulated.
- Ramp – up period(in seconds) :Time taken by the JMeter to invoke the threads
- Lop count : No of times the test plan should be repeated.
These properties can be varied depending on the requirements of the load test.
Shown below are the steps to follow while adding above elements.
Adding Thread group

Adding SOAP/XML-RPC request

In the request, Specify the name of webservice and set service URL from the SOAP action properties . Copy the SOAP xml in the SOAP/XML-RPC
Sample WS Request view

Note :- Before doing the load test make sure WS is having any prerequisites or not , if we have prerequisites like user authentication then we have add the user authentication to our test plan.
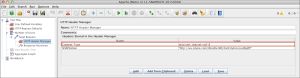
Next, select “HTTP Header Manager” and update “SOAPAction” header to match your webservice. Some webservices may not use SOAPAction in this case remove it.
Currently, only .NET uses SOAPAction, so it is normal to have a blank SOAPAction for all other webservices. The list includes JWSDP, Weblogic, Axis, The Mind Electric Glue, and gSoap.
Adding Headers
Adding a Timer Element

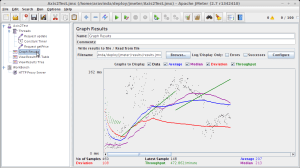
c) Running the test plan
Graph results element view
In the “View results in the table” element, status column illustrates whether service request completed successfully or failed.
View results in the table

To simulate high load on the server we can increase the no of threads and the loop count.
Once the test is done, “results.jmx” file will be created and this file can be used to visualize the results.loadosophia is one of the sites which offers graph generation services using the XML/CSV results files from JMeter and many other file types such as Apache benchmark tool files etc. You can log into the site using Google account and it provides a workspace to maintain test results related to various projects. Upload the .jmx file and set of graphs will be generated against various parameters such as response time, throughput etc
